In this entry of Inside the Stats we are going to run through the absolute basics of NHL Team stats/standings. Many hockey fans already know these details inside-and-out but, if you want a refresher, stick around! If not, click HERE to browse through other Inside the Stats entries.
NHL Regular Season and Playoff Structure
The NHL’s regular season and playoff structure doesn’t really qualify as a stat, but a brief description is necessary to provide context for the rest of the basic stats that we will discuss. The NHL regular season typically consists of 82 games – I say typically because the COVID-19 pandemic shortened the 2019-2020 and 2020-2021 NHL seasons. This past season (2021-2022) had a regular 82-game schedule, and future seasons – barring any global pandemics – are expected too as well.
There are 32 teams in the NHL, split into two, 16-team conferences. These conferences are further divided into two divisions each. The top ranking three teams from each division qualify for the playoffs, along with two “wildcard” teams from each conference. Ranking is determined by points – I’ll explain more about points in a moment, but for now all that is essential to know is that teams with the most points are ranked the highest. The wild card teams in each conference are the two teams with the most points who did not rank top 3 in their division.
If you’ve been doing some mental math, you’ve probably deduced that 16 teams qualify for the playoffs – eight from each conference. The playoffs consist of 4 rounds of best-of-7 series. The first round of the NHL playoffs is – in my opinion – the hockey calendar’s most exciting time of the year. There are 8 series in total (four per conference), so every night for about two weeks their are multiple high stakes hockey games being played. There is nothing more intense than 7 hard-fought hockey games against the same opponent. As a data guy I’m not a huge fan of baseless narratives, but the NHL playoffs is one of the times where even I can’t resist the narratives drawing me in. It’s truly the most wonderful time of the year. But I digress, this is supposed to be a serious educational article! Not a hockey nerd wistfully pining for the excitement of the NHL playoffs.
In the first round of the playoffs the first place team in the conference (and thus their division) plays the wildcard team with the least amount of points, and the first place team in the other division plays the other wildcard team. The second and third place teams in each division play each other. In the second round, the winner of each divisional second vs. third matchup plays the winner of the series between the winner of their division and the wildcard team. The final two teams standing in each conference face off in the third round, which is commonly called the conference finals, and the winners of each conference go on to play in the Stanley Cup Final.
Wins, Losses, Overtime and Points
Am I really going to explain what wins and losses are? Yes, I am. A team wins a game if they score more goals than their opponent, and a team loses if they score less goals than their opponent – I know, it’s very complex. The winning team is awarded 2 points in the standings, and the losing team is not awarded any points. There is a caveat though – a game can finish in regulation time (after the conventional 60 minutes of play) or it can finish in overtime, if both teams have scored an equal number of goals at the end of regulation time. A win is a win; whether the game finishes in regulation or overtime, the winning team is awarded 2 points. But, a loss is not a loss – a team that loses in overtime earns 1 point.
The fact that a loss is not a loss is incredibly silly. If an NHL game goes to overtime an extra point is created out of thin air. A game ending in regulation results in 2 points being awarded in the standings (winner gets 2, loser gets 0) but with overtime that number increases to 3 (winner gets 2, loser gets 1).
This system provides an incentive to “play for overtime” rather than try to win in regulation, because there is no downside of failing to win in regulation – winning in overtime will still get you the same number of points and losing in overtime gets you an extra point. This leads to risk-free, low-event, and frankly boring hockey in the latter half of third periods in which the game is tied. But you can’t blame the players or coaches for this – the system in place incentivizes boring hockey.
A more logical system would be 3-2-1, where a win is worth 3 points, an overtime win is worth 2 points, an overtime loss is worth 1 point, and a regulation loss is worth 0 points. Hopefully the NHL makes this change (or a similar one) in the future – certain games shouldn’t be worth more points than others!
Just for fun, the figure below shows the standings for the 2021-2022 NHL season if the point system was 3-2-1. The grey numbers in the ranking column represent the teams rank using the old system.
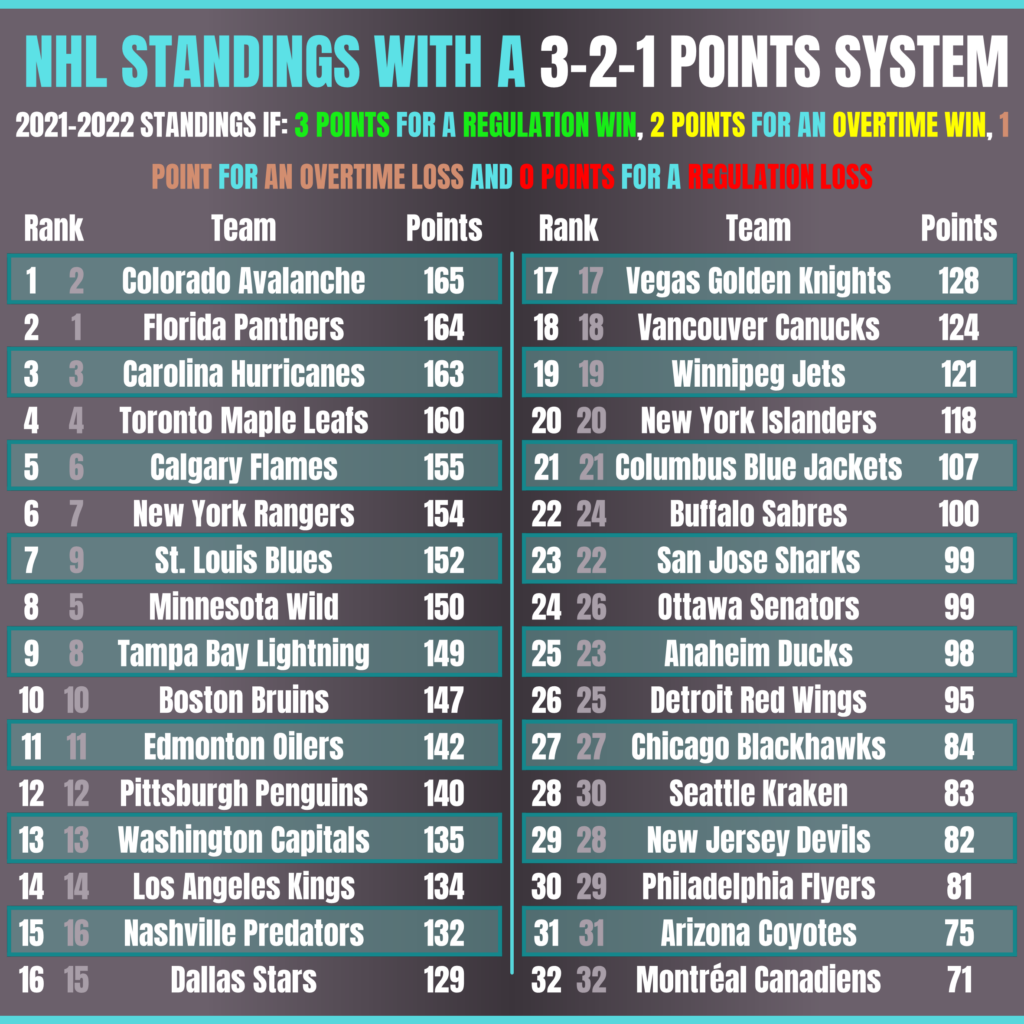
You might be thinking that this isn’t that different – the top teams in the old system are still at the top, and the bottom teams are still at the bottom. You’re right! But that is not the point, the purpose of switching the system is to motivate teams to play differently, not too drastically change the standings.
Goals and Shots For/Against
Goals are simple – A team is deemed to have scored a goal when the puck legally enters the opposing teams net. In this piece I’m not going to get into the intricacies of what constitutes a legal goal, because that water can get muddy – the topic deserves its own article. Goals For are the sum of the goals a particular team scores over the sample size of interest (e.g., a single game, month, season, or multiple seasons) and Goals Against are the sum of the goals a particular team has scored against them over the sample size of interest.
The Shots For and Shots Against definitions are identical with the Goals For/Against definition – except obviously that goals are replaced with shots. The team-centric definition of a shot is the same as the player-centric definition: A team is awarded a shot if a player on the team shoots the puck and they either; (1) score, or (2) the opposing goalie stops them from scoring (i.e. makes a “save”). Thus, if the player shoots and the puck misses the net, is blocked by an opposing skater, or hits the post the team is not awarded a shot.
Shooting Percentage and Save Percentage
Analogous to a player’s shooting percentage, a team’s shooting percentage is their total goals divided by their total shots. Similarly, a teams save percentage is simply their goalies’ total saves divided by shots against.
Why do we differentiate a team’s save percentage from that of their goalies? Good question. While typically a hockey team has a single goalie play for them in a single game, NHL teams always have at least two goalies play games for them in a single season. Goalie is a physically demanding position, even the best of them need to rest every once in a while. It is also not too uncommon for multiple goalies to appear in a single game for a team.
Shooting percentage and save percentage are cornerstones in most discussions of “luck analysis” in hockey, so expect us to revisit them frequently in the future.
Powerplay and Penalty Kill Percentage
If a player breaks a rule, their team is given a penalty by the referees. It is more complicated than that simple statement – lots of analysis’ have shown that factors other than rule breaking have a large impact on the frequency and number of penalties handed out. But I digress… that is a discussion better suited for a future entry of “Inside the Stats”.
Most penalty calls result in the non-penalized team getting at powerplay opportunity. This is not always the case, some penalties – such as fighting majors – offset each other and no powerplay is awarded to either team because a player from both teams is penalized.
A team with a powerplay opportunity has more skaters on the-ice than their opponent, who is attempting to “kill” the penalty. A penalty is successfully “killed” if the team with the powerplay does not score for the duration of the penalty (usually 2 or 5 minutes). If the team with the powerplay (or man-advantage) does score during the powerplay then the powerplay is considered successful and the penalty kill is not. Powerplays that resulted from minor penalty (2-minute penalties) calls terminate if a goal is scored, whereas powerplays resulting from major penalty (5-minute penalty) calls do not.
A teams powerplay percentage is their successful powerplays divided by their total powerplays, and their penalty kill percentage is their successful penalty kills divided by their total penalty kills.
I hope you enjoyed this look at some very basic team stats! Click HERE for more Inside the Stats statistic explainers, and remember to check back soon! The data side of this great game is constantly evolving and Inside the Stats will evolve with it! Expect frequent updates to the statistic explainers as well as completely new explainers on cutting-edge stats!
Discover more from Inside The Rink
Subscribe to get the latest posts sent to your email.