
Welcome to the daily playoff probabilities update. Here you can find win probabilities for each of the day’s NHL games, as well as player-level goal-scoring, point-producing, and “Top Threat” probabilities. These probabilities are calculated via the datadrivenhockey game simulation model, GPM1. Information about the model and links to get access to even more model outputs are provided at the end of this article.
Daily Predictions and Probabilities
Win probabilities, most likely final scores, and the “Top Threats” for each game are shown in the image below!
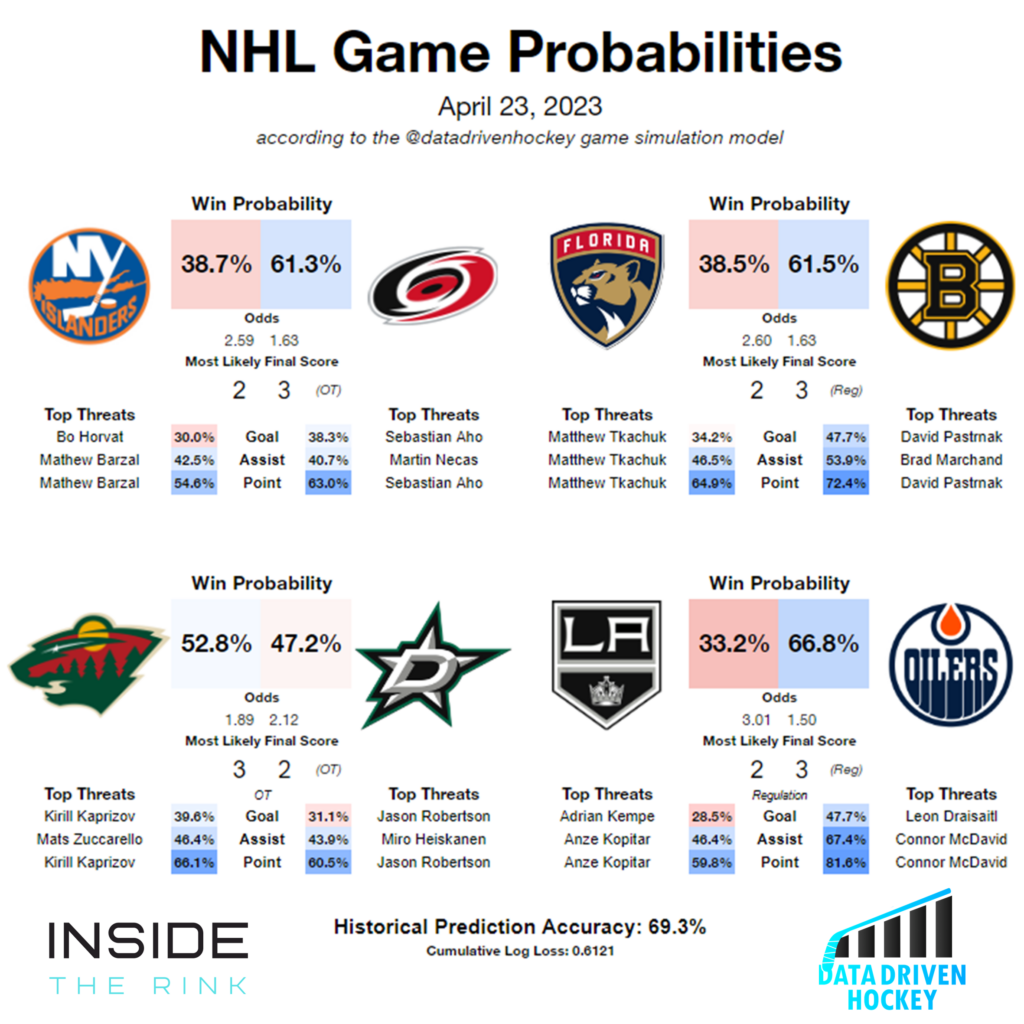
Based on a quick skim of the odds being offered by Ontario sportsbooks, there are a couple of good bets tonight – the Hurricanes and Oilers! According to the model, the Hurricanes are heavy-ish favorites, but the sportsbooks have the Islanders as the favorites. So, if you trust the model, there is some value potential there.
If you would like more in-depth coverage of tonight’s series, we’ve got you covered! Check out the articles below:
- With Bergeron Out, Bruins Need This Player To Step Up
- Can Oettinger Shine in the Playoffs Again for the Stars?
- Edmonton Oilers vs. Los Angeles Kings Playoff Series Preview
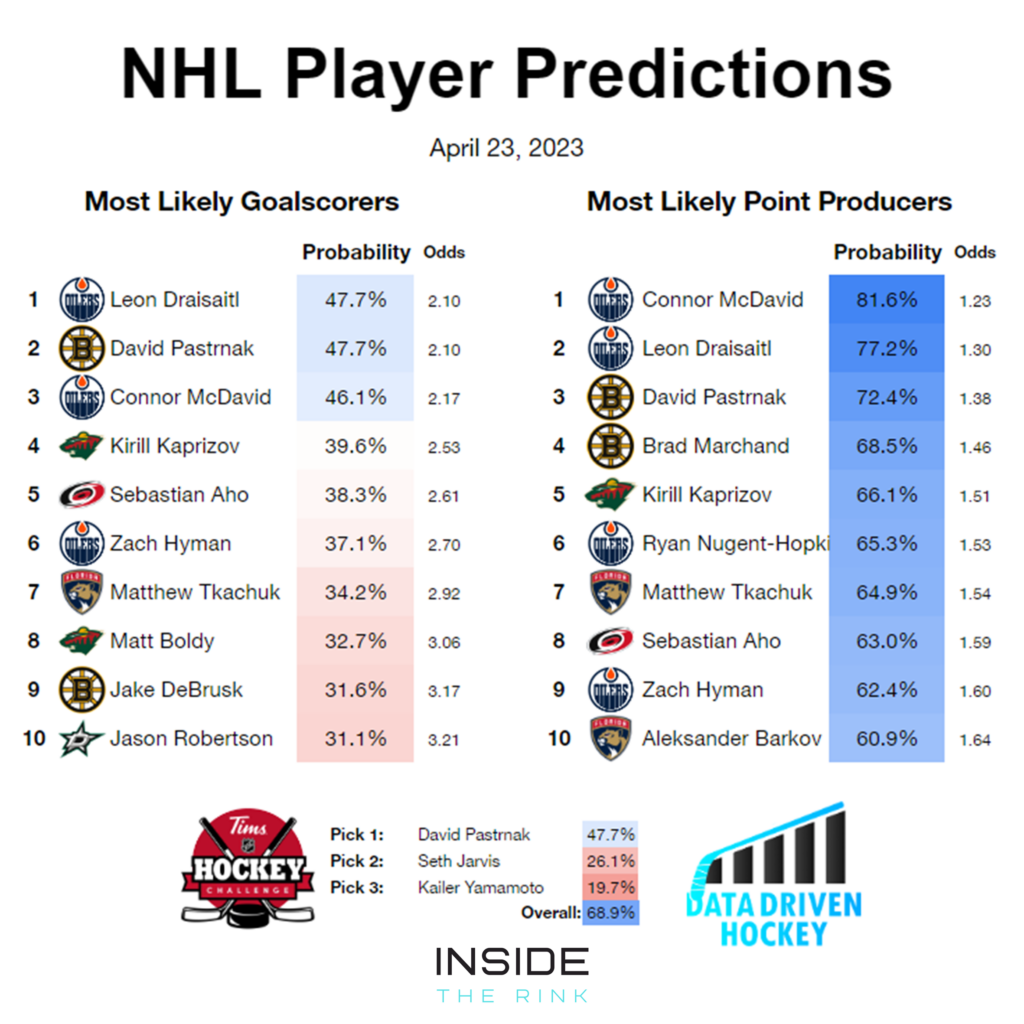
Enough about the games – let’s look at some player probabilities! The below image shows the top 10 most likely goal scorers and point producers for tonight’s games. As an added bonus, it also has the best Tim Hortons Hockey Challenge picks (it’s a Canada thing, sorry, Americans/Europeans/Others).
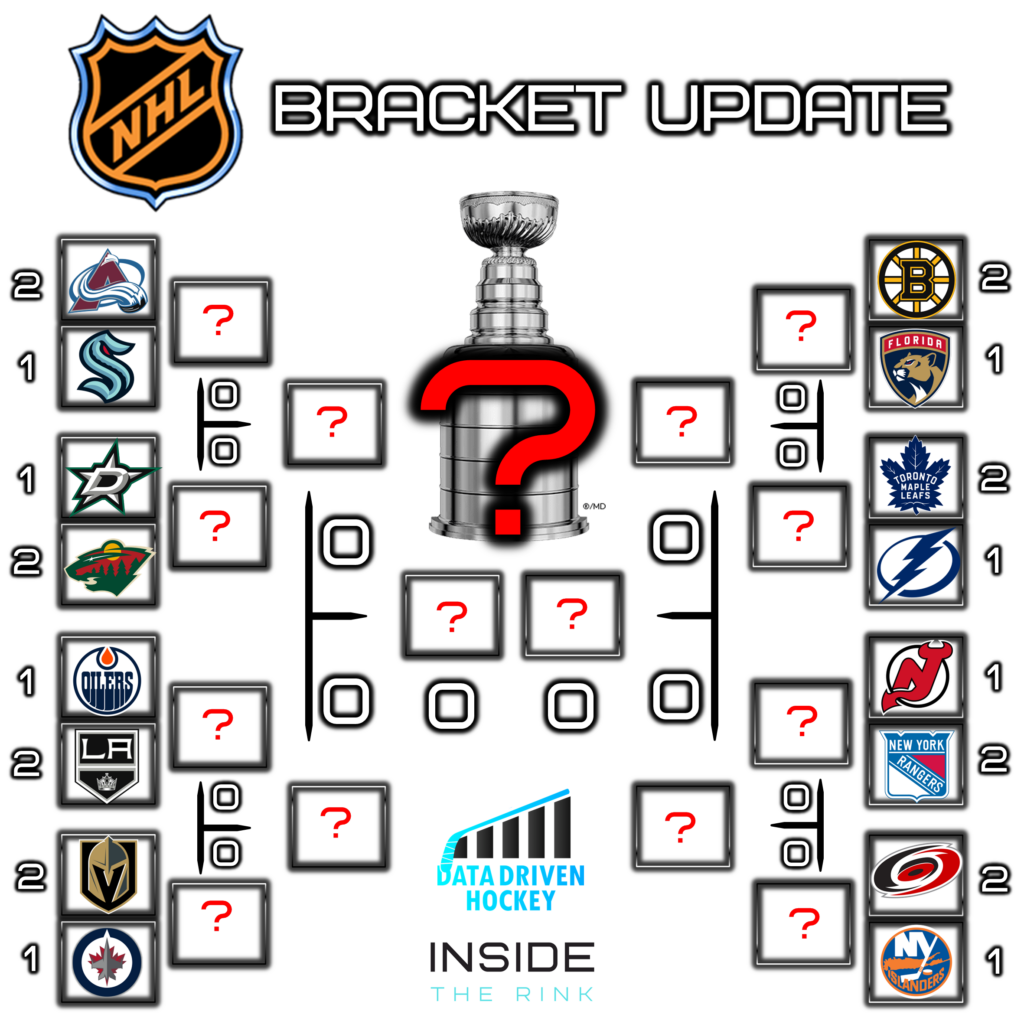
And below is a look at the Stanley Cup Playoffs bracket as of today.
Interested in access to more data?
Even more NHL probabilities are available on the datadrivenhockey Patreon! In addition to the probabilities in this article, you can find:
- Every players goal, assist, point, and 2+ point probabilities (matchup specific!)
- Game cards with over/under probabilities and probabilities of overtime for every NHL game
- Projection cards that show every NHL players: most likely end-of-season goals, assists, and points; the probability that they will hit important goal and point milestones, their probability of producing vs. an average NHL team and the probability they will win the Art Ross or Rocket Richard trophies
- NHL Fantasy content (in time for next season)
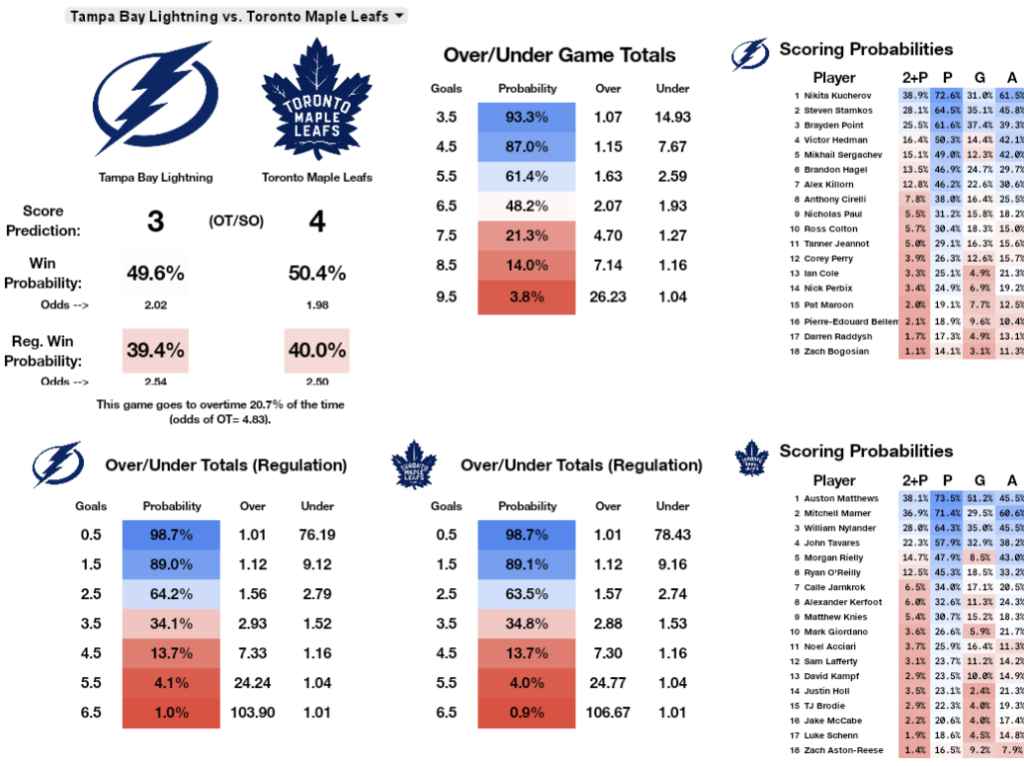
The image below is an example of a game card. This is from game 3 of the Leafs-Lighting first round series.
How does the model work?
I promised more info on the model, and the probability that I follow through on my promises is decently high, so here is some info on how the model makes its predictions.
Lineup Predicting: If it is available, the model scrapes lineup and starting goalie information. If not, the most recent saved lineup is used instead (the model saves the most recent lineups, so this lineup is usually quite accurate).
Player Scoring Probabilities per 30 seconds calculation: Each player’s individual goal-scoring, primary, and secondary assist rates are calculated using the @datadrivenhockey point projection model. The point projection model uses four years of data, age curves, potential estimation, and the DDH expected points/goals/assists model to calculate players’ projected scoring rates. Last season the point projection model had an average league-wide error of +/- 9.75 pts for forwards and +/- 6.6 pts for defensemen. The rates from this model are converted into production probabilities per 30 seconds of ice time for both even strength and PP situations.
Correcting for Defensive Skill of Opponents: The expected production rates of each player is adjusted using factors based on their opponent’s skill. These factors are calculated from defensive and goaltending metrics. The skill factors are: goal suppression ability vs. average team at 5v5 and goal suppression ability vs. average team on the penalty kill.
Other Corrections: Rest (time between games) and Home/Away is also considered when adjusting player production rates.
Game Simulation: Each game is simulated 5000+ times. Each game is split into 30 second intervals, and each player is assigned to play in a percentage of the intervals based on their average 5v5 and PP ice time this season. Powerplay opportunities for each team are sampled from a normal distribution, so each iteration of a simulated game has a different number of powerplay intervals available. For each 30 second interval for each player, a random number generator is used to evaluate if a player records a goal, primary assist, or secondary assist (if the random number is less than the probability of the event, we record that as an occurrence of the event). The total number of goals and primary assists a team records are combined with a weighted average to determine the total goals for each simulated game. The probability of winning is simply calculated by comparing the number of times each team “wins” one of the 5000+ simulated games.

Stanley Cup Aspirations – Cue’ the Duck Boats Pod
Discover more from Inside The Rink
Subscribe to get the latest posts sent to your email.