
Corsi and Fenwick are the original “advanced stats”. They are your grandparents’ analytics (not really, unless you have concerningly young grandparents). Hockey analytics have advanced since their infancy but nonetheless these stats are commonly referenced today. In addition to being original, Corsi and Fenwick are also easy to understand. This makes them a great choice if you are just getting your feet wet with analytics.
The title of this article includes a third item: on-ice stats. The phrase “on-ice stats” may be a bit misleading, because “on-ice” is in fact not a type of stat, but instead a method of contextualizing and utilizing a stat. This probably sounds very confusing, but some examples using on-ice Corsi will make everything crystal clear, I promise. Let’s jump in.
What are Corsi and Fenwick?
What are Corsi and Fenwick? The answer may feel underwhelming. Despite the tendency of the hockey community to refer to them as “advanced stats” Corsi and Fenwick are very simple concepts. Corsi is nothing more than another name for shot attempts. NHL.com defines shot attempts (Corsi) as: any time a player tries to shoot the puck. So, any shot on goal, blocked shot or missed shot is classified as a shot attempt. The name Corsi was given to the stat by a hockey blogger because he liked Jim Corsi’s mustache (Jim was the goalie coach of the Buffalo Sabres at the time).

(Photo by Bill Wippert/NHLI via Getty Images)
Fenwick is Corsi without the blocked shots. So only missed shots or shots on goal are counted as a Fenwick shot. Compared with Corsi, Fenwick is barely used in practice. We will spend at least one future article on the uses of Fenwick, but for the rest of this piece we will focus solely on Corsi. However, all the concepts we will discuss with respect to Corsi can also be applied to Fenwick.
Ok great – we have a facial-hair inspired name for shot attempts. Why? Good question. What inspired someone decide to rename shot attempts and classify them as an “advanced stat”? It boils down to frequency. There are more shot attempts in a hockey game than there are shots, and there are a hell of a lot more shot attempts then there are goals. The pioneers of Corsi recognized this and thought that maybe shot attempts would be a better indicator of a teams’ skater’s skill than the actual goals-based result of the game. Play-driving ability is more accurately measured by the number of opportunities created rather than the amount of goals scored. On the surface this concept probably feels intuitive – we’ve all watched a sporting event where one team heavily out chanced their opponent but ending up losing. We still typically view the losers as the better team and say they “got unlucky” or “played against Igor Shesterkin”.
So, do our feelings about Corsi match reality? Are players that “out-Corsi” the opposition typically more successful over larger sample sizes than just a single game? When will Dominoes bring back 50% off all pizzas? Later in this very article I will attempt to answer these questions – but first, we need to discuss the types of Corsi data that is collected, and common methods of manipulating that data.
Individual Corsi
The first concept we will briefly touch on is the rawest form of corsi data – an individual skater’s Corsi. The formal name of this stat is individual Corsi or individual Corsi For. Individual Corsi For is exactly what it sounds like: the specific players personal shot attempts.
Individual Corsi For isn’t a very commonly referenced stat – mainstream hockey types are much more likely to reference a players shot total and/or rate (rate on a per game played or per 60 basis) as opposed to their Corsi number. On the other hand, analytics nerds might reference a player’s individual Corsi when discussing their performance, but in my experience, most prefer individual expected goals (which you can learn about here).
While individual Corsi doesn’t see much use these days, on-ice Corsi (and on-ice stats in general) does. Let’s get to the good stuff.
On-Ice Corsi
I’m getting tired of using the clunky “that player”, “the player’s” and “that players team/opposing teams” phrasing so I’m going to make up an imaginary player who’s name I can use instead. I’ll call him Freddy.
A shot attempt made by Freddy or one of his teammates while he is on the ice is counted as an on-ice Corsi For for Freddy. Conversely, a shot attempt made by the opposing team while Freddy is on the ice is counted as an on-ice Corsi Against. This concept, “on-ice” is how Corsi is used 99% of the time, with individual Corsi and lame dog-related jokes making up the other 1%. We get it, Corsi is Corgi with an “s” instead of a “g”. Hilarious.
On-ice Corsi For allows us to assess Freddy’s shot attempt generating/possession driving ability and compare him to his teammates and the rest of the league. On-ice Corsi Against lets us assess how Freddy impacts his team’s rate of giving up shot attempts. In general, on-ice Corsi gives us an idea of how well Freddy drives play, with the obvious caveat that it is a far from perfect measure given Freddy’s linemates and opponents (among other things) are also affecting the game play.
As the use of the “on-ice version” of Corsi accounts for the vast majority of applications, the prefix is typically dropped, for brevity. Freddy’s on-ice Corsi For is typically referred to as his Corsi For and his on-ice Corsi Against is analogously called Corsi Against. I will adopt this convention for the remainder of this article and in all future articles.
As I’ve alluded to already, on-ice stats are not perfect, unbiased representations of a player’s ability, but they are a step towards that ideal. Relative on-ice stats and adjustments that account for teammates, score effects and more will all be discussed in future articles in excruciating detail.
Corsi Differential
When we know Freddy’s Corsi For and Corsi Against we can calculate his Corsi differential (typically just called his Corsi) which is his Corsi For minus his Corsi Against. This is like the calculation of plus/minus except that it’s useful, and in the case of Corsi, the sample size is much larger.
Aside: large sample sizes are awesome. To learn more about why, I recommend picking up a stats textbook (or googling it). In the future I plan on dedicating an article to some more pure stats topics – and their application in hockey analysis – so you could also wait for that if you prefer.
Anyways, lets get back to the Corsi differential talk. Corsi differential is an unrefined form of on-ice Corsi. Not quite raw, but certainly not a succulent and juicy medium rare. Corsi differential is rarely used in player evaluation because it cannot be used to compare players who have played a different number of games. Imagine Freddy had a +1 on-ice corsi differential every game over a 20-game stretch – that’s a +20 Corsi differential.
Now, imagine one of Freddy’s teammates, Frida, was injured to start the season and has only played in 4 games. In those 4 games Frida had an Corsi differential of +5, +3, +8, and +4: that’s also a +20 Corsi differential. Obviously presenting only the raw Corsi differential is misleading; the game-by-game breakdown clearly indicates that when Frida is on the ice the team is out chancing the opponent at a much higher rate than when Freddy is on the ice.
The comparison improves when we apply the concepts of “per 60 minutes” or “per game played (GP)” to Corsi differential. You can read in detail about how we calculate stats per 60 and per GP HERE, but briefly, per 60 stats correct for a player’s total time on ice and per GP stats correct for the amount of games an individual player has played. In the context of this example, we can quickly calculate that Freddy has a Corsi/GP of +1 and Frida has a Corsi/GP of +5.
That’s nice, isn’t it? Utilizing per 60 and per GP stats we can immediately see that at when Frida is on the ice the team is generating a lot more shot attempts vs. the opponent than when Freddy is on the ice. Alright, just for fun, let’s look at some real world numbers! Here are the Corsi per 60 leaders in the NHL last season (2021-2022).
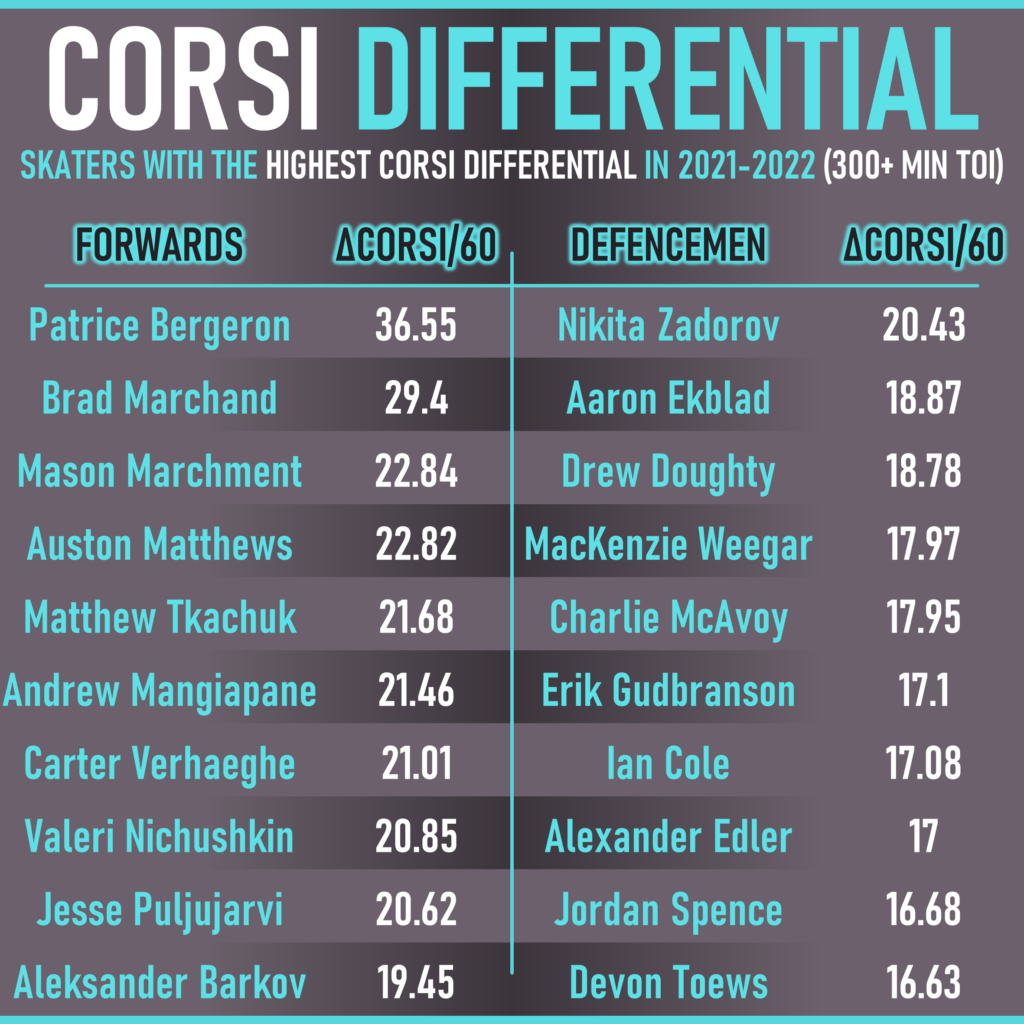
If you’re a fan of the NHL, the top of the forwards list won’t surprise you. Patrice Bergeron won the Selke trophy as the leagues best two-way (offensive and defensive) forward last season, and his Corsi differential per 60 indicates that the win was well deserved. The presence of some other players on this list alludes to the inherent bias in on-ice stats for players who are on the ice a lot together. Brad Marchand is Bergeron’s most frequent line mate- he’s a great player in his own right, but deeper analysis (that we won’t be getting into today) suggests that while he does have a positive impact on Corsi differential, it isn’t in the same realm as Bergeron.
There are a couple other line mate pairs here – Verhaeghe/Marchment and Tkachuk/Mangiapane. This further supports what I have been saying: on-ice stats – despite their obvious utility – are unable to provide an unbiased estimate of a players impact by themselves. As I’ve already said, we will discuss “extensions” of on-ice stats that are intended to minimize this bias in future articles.
The Holy Grail: On-ice Corsi For Percentage
Corsi For Percentage is defined as Corsi For divided by the sum of Corsi For and Corsi Against. It is the percentage of total shot attempts that are taken by Freddy’s team while he is on the ice. Corsi For Percentage is far and away the most common form of on-ice Corsi used in practice. It provides essentially the same information as Corsi differential per 60, but in a percentage form instead of in absolute form. Remember Freddy’s 20-game stretch from earlier during which he had a Corsi of +20? Over that time he recorded a Corsi For of 80 and a Corsi Against of 60. So, Freddy’s Corsi For Percentage is 80/(60+80) = 60%.
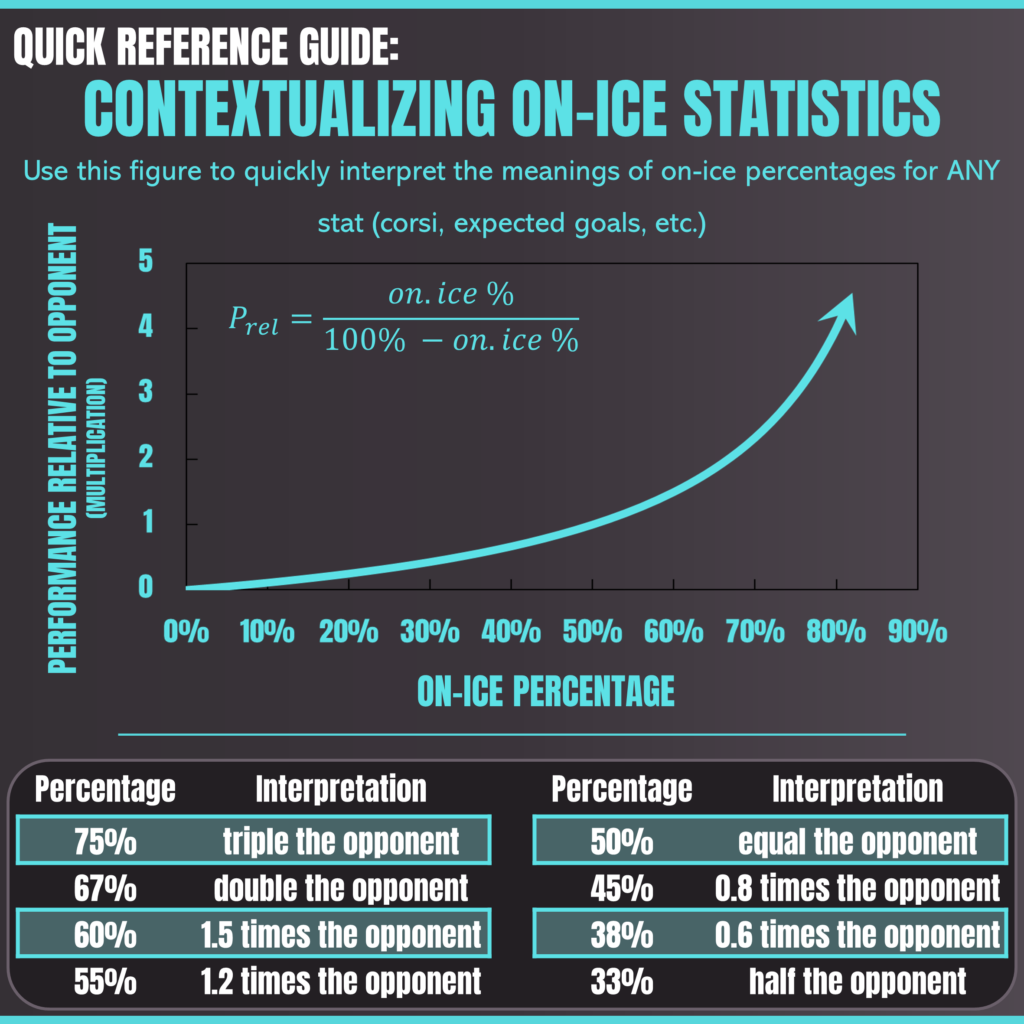
Corsi For Percentage is widely used because of how easy it is to interpret. A Corsi For Percentage above 50% indicates Freddy’s team is out-chances the opposition when he is on the ice. If his Corsi For Percentage was below 50% his team would be the one getting out-chanced. Typically NHL player Corsi For Percentages fall in the range of 40-60%. If a player is on either side of this range they are especially good or especially bad. In general, anything above 55% is considered very good and anything below 45% is considered very bad. Here’s a quick reference guide for easy interpretation of on-ice percentages.
Now – finally – let’s try to answer the question we had about Corsi from the very beginning: is it useful? Pretty important question, eh? Imagine me writing all this and it turning out that everything I was saying is bunch of garbage. I’d have to call it something like “The Toronto Sun”, or “12 Rules for Life”. Anyways, even though the idea that out-chancing (or out-Corsiing) your opponent is a good thing feels intuitive – intuition isn’t evidence! So, lets do some evidence-based analysis and answer this question: Are players that “out-Corsi” their opposition more successful in the long run?
How do we begin to answer this question? The logical place to start is to formalize our definition of “successful”. Hockey players “succeed” if their team scores more than the opponents team, so let’s define “successful” as having a high On-ice Goals For Percentage. Goals For Percentage is analogous to Corsi For Percentage, except Goals For and Goals Against replace Corsi For and Corsi Against in the calculation. If Freddy has a Goals For Percentage above 50% it means his team outscores the opposition while he is on the ice. Higher Goals For Percentage = greater success.
Alright, with our definition for success in hand we will proceed with the analysis. Let’s look at all the NHL forwards who played at least 250 5-on-5 minutes in both the first and second half of the 2021-2022 season. If we plot their first-half Goals For Percentage and Corsi For Percentage against their second-half Goals For Percentage we can determine which stat is more predictive of future success. Is it past success (Goals For Percentage) or past possession (Corsi For Percentage)?
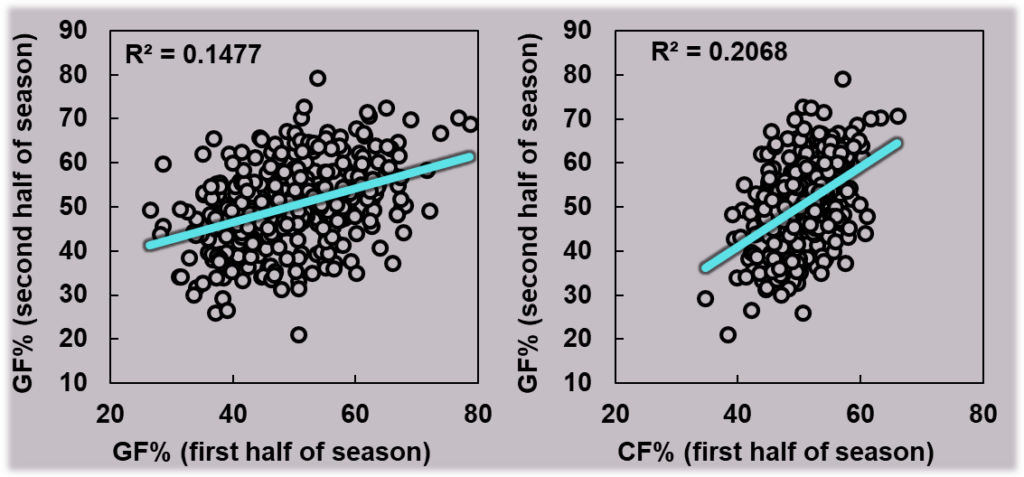
Using the “eye-test” on the data points and trendlines doesn’t yield a ton of useful information (though the data points might hug the trendline a bit tighter on the Corsi plot compared to the Goals plot, but that may just be my confirmation bias). Luckily, we have the R2 statistic! R2 measures the correlation between variables. An R2 value of 1 implies perfect correlation and an R2 value of 0 implies no correlation. Using R2 we can conclude that first-half Corsi For Percentage correlates better with second-half Goals For Percentage than first-half of season Goals For Percentage. Thus, Corsi is a better predictor of future success than past success is! Corsi is useful, and math is cool.
Team-level On-ice Stats
On-ice Corsi For Percentage and Corsi Differential (and all other on-ice stats) are frequently applied at the team level in addition to the player level. Rather than using an individual players Corsi For and Corsi Against in the calculation the team’s Corsi numbers are used.
The debate around if team-wide Corsi For Percentage predicts future success is ongoing – at least in my mind. However, we do know that teams with good Corsi numbers are generally successful while putting up those numbers. Here’s an Instagram post from my account that touches on this topic.
We will talk a lot more about on-ice stats at the team level in future articles – I just wanted to acknowledge their existence briefly before wrapping this one up.
Final Thoughts
I hope you enjoyed this introduction to Corsi, Fenwick (remember that?) and on-ice stats! If you’re going to take away only one thing from this article, let it be the concept of on-ice stats. On-ice stats are widely used and a core building block of many other analysis, such as relative to teammates and RAPM. And, as I’ve mentioned a couple times now, the concept of on-ice extends well beyond Corsi. Many different stats can be viewed through the on-ice lens, such as:
- Corsi and Fenwick (duh)
- Expected Goals
- Shots
- Goals
- Scoring Chances
- Shooting Percentage
- Save Percentage
If you aren’t familiar with the above stats, just poke around Inside the Stats – I bet you will find what you are looking for! If you don’t – leave a comment and let us know – it helps us prioritize what to get to you first!
Remember to check back soon! The data side of this great game is constantly evolving and Inside the Stats will evolve with it! Expect frequent updates to the statistic explainers, completely new explainers on cutting-edge stats and “current” articles looking at recent trends and stats in the NHL!
Discover more from Inside The Rink
Subscribe to get the latest posts sent to your email.


Thanks for explaining these concepts very thoroughly and clearly.