
Expected goals are one of the most useful analytics concepts. They are also the most heavily criticized – some of which is warranted, and some not so much. One thing that is certain is expected goals has ballooned in popularity in recent years. For those who haven’t heard of it or have heard of it but brushed it off because “the dang nerds are ruining hockey”, you have come to the right place. Let’s jump in.
What are/is Expected Goals?
Expected goals (xG) is a model-based metric used to isolate the evaluation of play-driving and chance-creation/suppression ability from things a player cannot control such as bounces, quality of goaltender, etc. The models make use of the public data tracked by the NHL. The NHL tracks every unblocked shot attempt (Fenwick) and collects over 100 pieces of information per unblocked shot attempt (shooter, location on ice, type of shot, etc.). Analytics nerds leverage this historical data to train the data-driven expected goals models.
The models are applied to new shot attempt data to calculate the “probability of goal” for those shot attempts. For example, a one-timer from the slot might have an expected goals value of 0.25, because that type of high-danger opportunity results in a goal 25% of the time. Common jargon is, “that scoring chance was worth 0.25 expected goals.” (Note: I made up the number for that example, not every slot shot is worth 0.25 expected goals.)
For the visual learners, here’s a figure we can use to conceptualize how an expected goals model works.
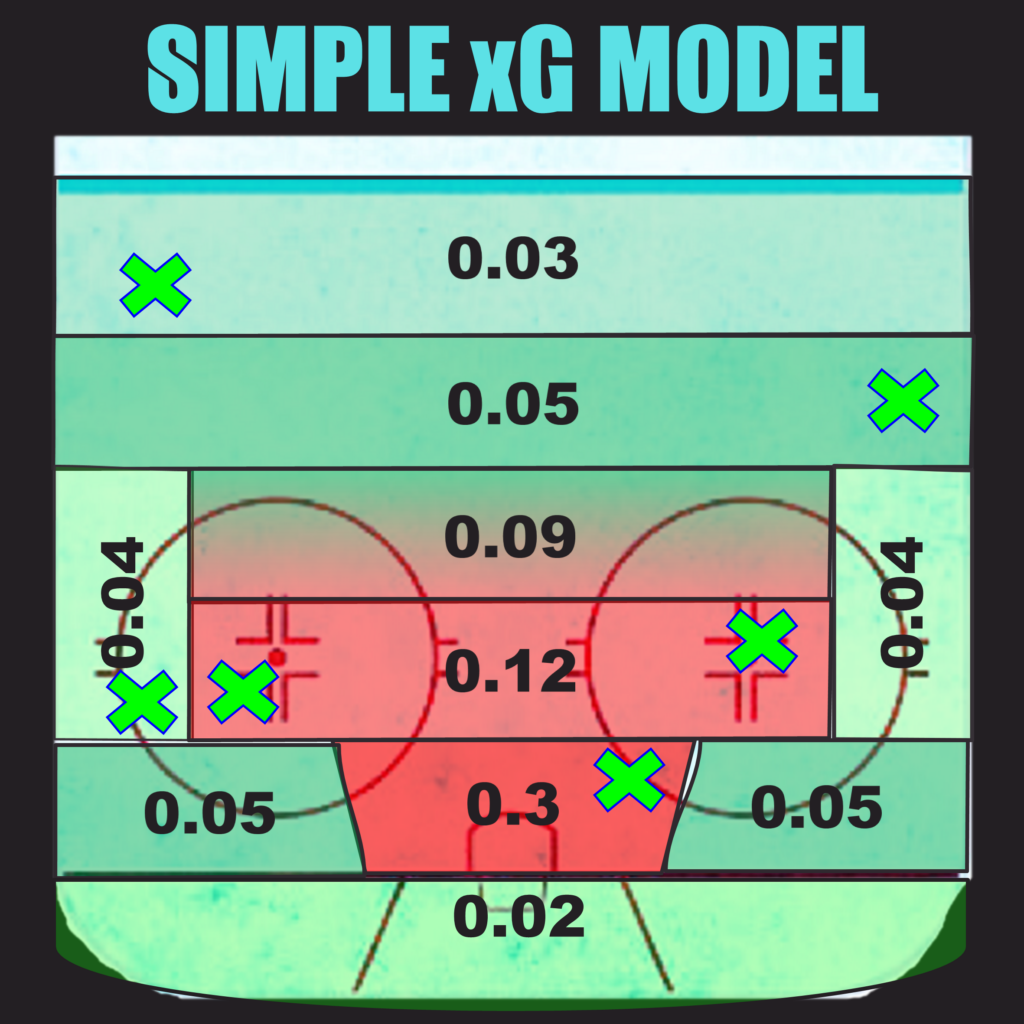
The numbers super-imposed on the rink represent the chance an unblocked shot attempt from that location will result in a goal – e.g., a shot from the point has a 3% chance of resulting in a goal. Another way to look at those numbers are as the expected goals themselves, so a player who has a shot attempt from the point technically “scores” 0.03 expected goals. This is not typical jargon; it is much more common to say, “Matthews had 1.5 expected goals” rather than, “Matthews scored 1.5 expected goals.” The word “score” is reserved for real goals, even among nerds.
So, if Matthews played a game and took shots from all the X‘s on the image, he would finish the game with: 0.03+0.05+0.04+2x(0.12)+0.3 = 0.66 expected goals, regardless of how many of his shot attempts actually resulted in him scoring.
Remember, do not put any stock into the numbers on this figure. While I chose values that seemed reasonable in my head, this is simply a fabricated example to illustrate the concept. Real expected goals models are a lot more complicated and accurate.
Speaking of real models, lets look at one. This figure shows the model features (i.e., input variables) of Evolving Hockey’s expected goals model – one of the best publicly available models.
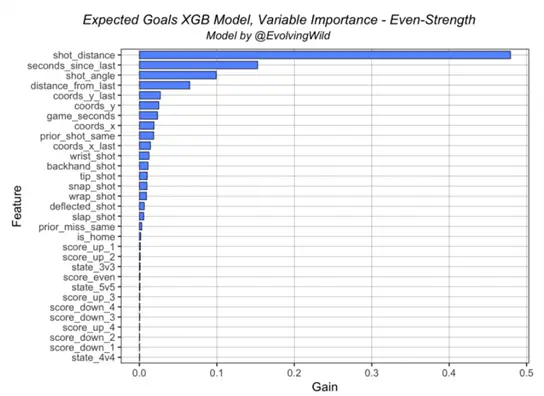
The length of the blue lines, or “gain”, represent the magnitude of the impact that each feature has on the model. There are a lot more factors than just shot location in a real expected goals model. We can see that “shot distance” (how far away from the net the shooter is), “seconds since last” (how long it has been since the last shot was taken – think rebounds) and “shot angle” (how centralized the shooter is) are the most impactful features. Intuitively, those features having a large impact makes sense.
I want to discuss an aspect that people tend to get hung up on – the fractional/decimal nature of expected goals. I find this to be especially true when someone is hearing/learning about expected goals for the first time. Going back to the figure, we calculated Matthews had 0.66 expected goals over the course of the game. This sounds a bit silly the first time you hear it. How can a player have 0.66 goals? We obviously cannot expect that Matthews scores 0.66 goals.
Imagine in the first period of Matthews’ next game he had a shot attempt from the low slot and from the side wall – so over the course of his last 4 periods of hockey he has 0.66 + 0.04 + 0.3 = 1 expected goal! We can interpret this as “based on the scoring chances Matthews accumulated over the past 4 periods he should have scored”.
By “should” I mean that him having scored 1 goal would be the most likely scenario assuming he has league average shooting talent and is shooting against league average goaltenders. So am I saying in that first game he should have scored 0.66 goals? Not really. We are comparing a discrete event (scoring a goal) to a continuous value (expected goals) so their will always be discrepancies. And remember – not every goalie is league average, not every player has the same shot, and the game is played with a bouncy piece of rubber on ice.
So what’s the point if expected goals models are almost always going to be “wrong”? Great question. I’ll try to answer it below…
Expected Goals: Applications
There are numerous useful applications of expected goals models for player and team evaluation and prediction. Just like with Corsi and Fenwick, we can view this stat through multiple lenses, including:
- Individual expected goals
- On-ice expected goals (both For and Against)
- Expected goals differential
- Expected goals percentage
- Relative expected goals
You should recognize most of the concepts (on-ice, individual, differential, percentage) from the Inside the Stats entry on Corsi and Fenwick – if you haven’t read it yet or need a refresher you can find it here. The on-ice concepts – including differential and percentage – are applied to expected goals in exactly the same way they are applied to Corsi so I will not spend time rehashing the definitions here.
On the other hand, individual expected goals are a lot more useful and interesting than individual Corsi. We will discuss individual expected goals in the next section, and then introduce the concept of relative on-ice stats to wrap up. Keeping with the theme of this article we will introduce relative on-ice stats in the context of expected goals, though just like other “on-ice” concepts “relative” can be applied to Corsi, Fenwick etc. as well.
Individual Expected Goals
Individual expected goals are, well, exactly what they sound like; an individual players expected goals. An informal definition of individual expected goals is this: expected goals generated from a player’s personal unblocked shot attempts (the puck coming off their stick). Simple right? In the example with Matthews and the conceptual expected goals model the 0.66 expected goals that Matthews generated are his individual expected goals.
Why is this useful? Well, generally we can divide players into three categories – players who typically underscore their expected goals, players that typically overscore their expected goals, and players that score at a rate similar to expected. If a player that typically falls into one category finds themself in a completely different one over a stretch of games we know one of two things has occurred; (1) their shooting talent randomly and fundamentally changed, or (2) more likely, their luck has randomly taken a swing either up or down.
We need to accumulate a few seasons worth of data before we can confidently place a player into a category. Take Jack Hughes for example – his first two seasons in the NHL were both shortened by Covid-19. During these seasons he put up great expected goals numbers but was not getting the results on the score sheet. Rather than shout, “BUST!” nerds shouted, “WAIT! His expected numbers are good, give him time!” The nerds were right. Hockey is a game of bounces – small sample sizes and puck luck play a much larger role in results than most would like to admit.
When we have accumulated enough data to ascertain what category a player slots into the real fun begins. We can compare their recent goals and expected goals numbers and draw some conclusions about their current level of luck and what direction their luck is heading. Aside: If we’re feeling especially nerdy, we can even build a shooting talent adjusted expected goals model with this data! This is something I have done – I will discuss it in a future article.
Let’s talk through some specifics. Brady Tkachuk of the Ottawa Senators and Brendan Gallagher of the Montreal Canadiens are two examples of players that typically underscore their expected goals. Both these players tend to jam the puck in tight into the goalies’ pads – a play that expected goals models typically overrate even though it is not a high percentage scoring chance. If you ever notice either of these players go on a goal-scoring heater go check their recent expected goals numbers (I recommend NaturalStatTrick.com). If they are overscoring their expected goals, or even just scoring at a similar rate to expected, it is probably unsustainable.
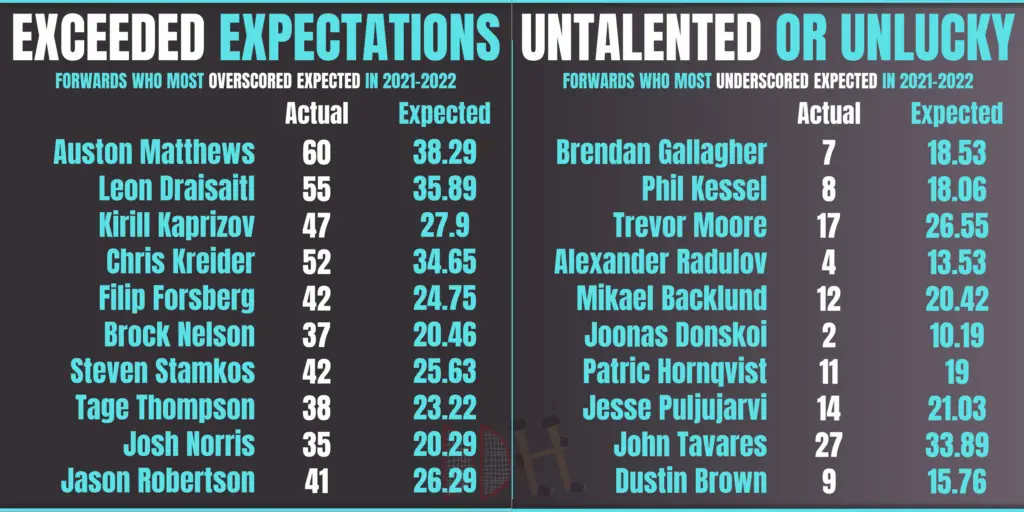
At the other extreme we have players like Auston Matthews and Leon Draisaitl. These two consistently overscore their expected goals. In the 2021-2022 regular season Matthews had 60 goals but only 38.3 expected goals. Typically a stat line like that would raise a red flag, but Matthews is an exception as he has consistently proven his ability to exceed his expected numbers.
Relative Expected Goals
We’re going to take a bit of a swerve and look at how expected goals can shine some light on a player’s overall impact, rather than just their shooting talent/scoring luck. On-ice expected goals have an analogous interpretation to on-ice Corsi, some even argue the availability of expected goals models renders Corsi obsolete.
What do I mean by this? Well, you may remember from the Inside the Stats entry on Corsi that we typically use on-ice Corsi to measure play-driving and opportunity creation/suppression ability. Corsi is preferred to purely results based measurements like goal-scoring because of the frequency of Corsi events compared to goal events. There are a lot more shot attempts in a hockey game than there are goals. The same is true of expected goals – there are a lot more “xG” events than there are actual goals scored. Because expected goals measure the quality and quantity of shot attempt (rather than just quantity as Corsi does) many analytics nerds prefer using expected goals rather than Corsi – some view expected goals as “upgraded” Corsi.
While I prefer expected goals to Corsi in most cases, it is important to recognize that expected goals models are built using Fenwick shots, not Corsi shots, so they do not account for blocked shots and lack information compared to Corsi. In a future article I will break down the benefits of Corsi and xG in different scenarios, for now it is sufficient to know that analysts typically use on-ice xG and on-ice Corsi to justify similar conclusions. Expected goals has all the same on-ice definitions as corsi – On-ice Corsi For is analogous to on-ice expected goals for, on-ice corsi against is analogous to on-ice expected goals against, corsi for % is analogous to expected goals % – I think you get the idea.
Alright, that’s enough pedantic rambling on the subtle differences between Corsi and xG, lets get to the good stuff – relative on-ice stats! Relative stats measure how a player performs in a given stat vs. their teammates, thus they are essentially a measure of a players impact. A player’s relative expected goals are defined as the difference between their team’s expected goals when they are on the ice and their team’s expected goals when they are off the ice (in games they are dressed for). The stat can be presented in any “on-ice form” – expected goals for, expected goals against, expected goals for percentage, etc.

This may sound overly theoretical and mathy, so let’s consider a practical example – Auston Matthews and the Toronto Maple Leafs last season (2021-2022). Last year Matthews had a 5v5 expected goals for percentage (xGF%) of 63.9% and the Leafs had an xGF% of 55.2%. Instinctively you might think that subtracting 55.2 from 63.9 (8.7%) should give you Matthews’ relative xGF%. That sounds right, but its incorrect – the 55.2% xGF% that the Leafs had includes time when Matthews is on the ice, and we need to use the Leafs’ xGF% only when Matthews was off the ice. That number is a much lower 50.9%, resulting in Matthews having a staggering relative xGF% of 13%. This put him at second in the league behind Patrice Bergeron. A complete lists of the 2021-2022 relative xGF% league leaders for forwards and defensemen are shown below.
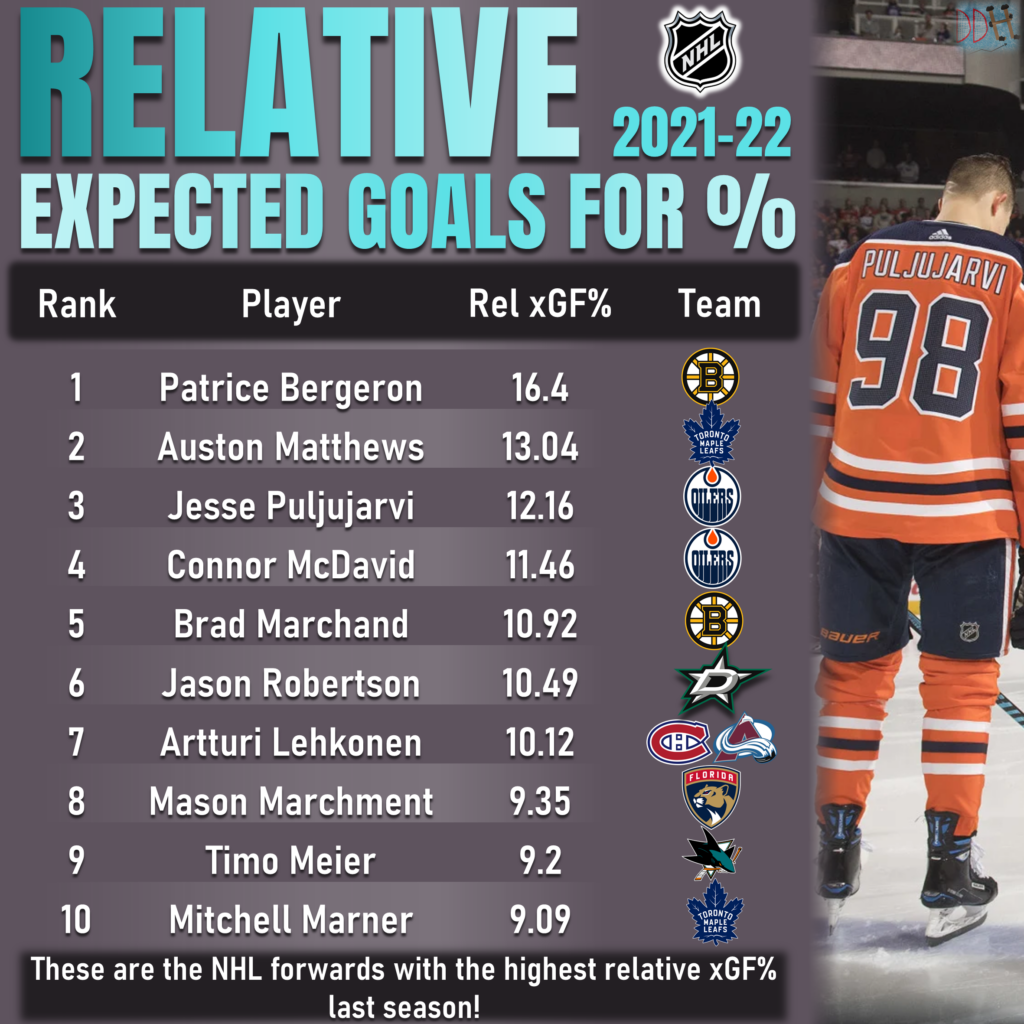
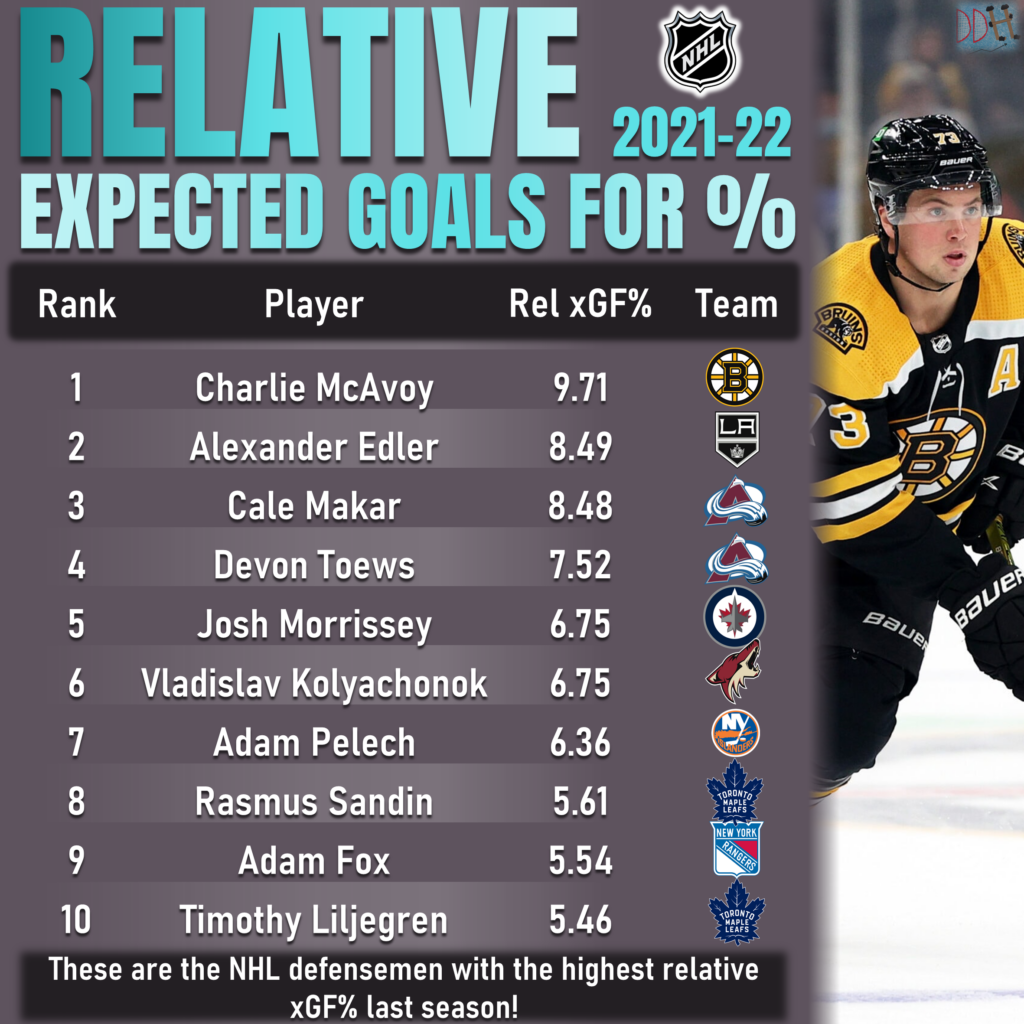
If you are a regular fan of the NHL you know these lists are populated with some pretty great players (Bergeron, Matthews, McDavid, Makar, McAvoy, Pelech, etc.). The stats match our intuition about these players – these are high impact players, and relative xGF% backs this up. On the other hand, their are a few players on these lists who are generally not seen as high impact players, or at least are more divisive in the wider hockey community (Puljujarvi, Lehkonen, Marchment, Sandin, Liljegren, Kolyachonok). This raises some questions – is relative expected goals telling us something our eyes are missing? Or is relative expected goals perhaps not capturing the full picture?
The answers to these questions are yes and yes. Relative expected goals does not give us the full picture. It effectively isolates a players on-ice expected goals from the team average on-ice expected goals, but in cases where individual players play a lot with the same group of players it cannot effectively isolate their impact from that group. Use numbers to inform your opinions and analysis, but always contextualize these numbers with as much (unbiased) additional information as possible. RAPM (Regularized Adjusted Plus Minus) is a more complicated metric that attempts (and in many cases succeeds) to fully isolate an individual players impact. RAPM will be discussed in future articles.
I hope you have enjoyed the “Inside the Stats” entry on expected goals! Click HERE for more “Inside the Stats”, and remember to check back soon! The data side of this great game is constantly evolving and “Inside the Stats” will evolve with it! Expect frequent updates to the statistic explainers as well as completely new explainers on cutting-edge stats!
Discover more from Inside The Rink
Subscribe to get the latest posts sent to your email.


If a players actual goals don’t match his expected goals is it fair to assume his shot is not that good? It seems the major inputs in your example expected goals model reward players who get into good areas and situations. If their actual goals don’t match up perhaps they have a problem with shot speed and/or accuracy.
I don’t see much in the way of a proactive demonstration that the program is better than the experienced observer. If, for example, a goalie fails to make a stop the program says he should make one of two things is wrong. 1. the goalie or 2. the program.
Asserting the program is correct doesn’t make it so. And further, I don’t see convincing data that all variables are taken into account in making predictions. An experienced observer can surely make adjustments for unexpected situations, and would therefore be superior in evaluating a specific play. I can see value in quickly ranking a large number of unknown players, who can then be evaluated directly. But I see it being used to conclude an individual player performed poorly in a game because he didn’t match the prediction. That seems like a flawed use of the data.
Interesting read! I never realized how much of a difference expected goals could make in evaluating goaltenders. It’s fascinating to see how some goalies perform better than others when you take expected goals into account. Great job breaking down the stats and providing insights to the readers!