In this entry of Inside the Stats we are going to quickly run through the absolute basics of NHL Goaltender stats. Many hockey fans already know these stats inside-and-out but, if you want a refresher, stick around! If not, click HERE to browse through other Inside the Stats entries.
Shots/Goals Against, Saves and Save Percentage
A goalie is credited with a shot against when the puck is touched by a member of the opposing team and the goalie must block/catch/stop it from entering the net to prevent a goal. This distinction is important because missed shot attempts, shots that hit the post and don’t enter the net, and shots that the goalie blocks but were not on a trajectory to hit the net DO NOT count as shots against. Basically, the only type of shot attempt that counts as a shot against is either a) a goal or b) a shot attempt that would have resulted in a goal if the goaltender had not intervened.
Saves are a subset of shots against. A shot against is a save if it does not result in a goal for the opposing team. If the shot against does result in a goal for the other team, it is a goal against.
Save percentage is simply saves divided by shots against. It is a useful metric for evaluating goalies because it allows you to compare the performance of multiple goalies who have faced a different number of shots against. In recent years “advanced” metrics for evaluating goaltender performance have been developed but save percentage is still the most popular stat to reference when discussing hockey goalies.
An odd aspect of save percentage is how it is communicated. Imagine that a goalie faced 10 shots against and allowed 1 goal. Thus they made 9 saves, and saved 90% of the shots. So, this goalie has a save percentage of 90% right? WRONG. This goalie has a .900 save percentage – pronounced “nine hundred” not “point nine”. Why do we communicate a simple percentage in this nonsensical way? I wish I could tell you. This feeling is commonplace for a hockey fan – the more you learn about the way this sport is run, the more confused you will become.
Anyways, there are more details I need to clarify with respect to communicating save percentage before we move on. Here are some additional examples: a goalie who saves 90.8% of the shots they face has a .908 save percentage, pronounced ‘nine-oh-eight’. A goalie who saved 92% of the shots they faced has a .920 (‘nine-twenty’) and a goalie who saved 89.6% of the shots they faced has an .896 (‘eight-nine-six’). These examples should provide enough context to allow you to effectively communicate about save percentage without sounding like a normal human being who understands basic mathematical conventions (sigh).
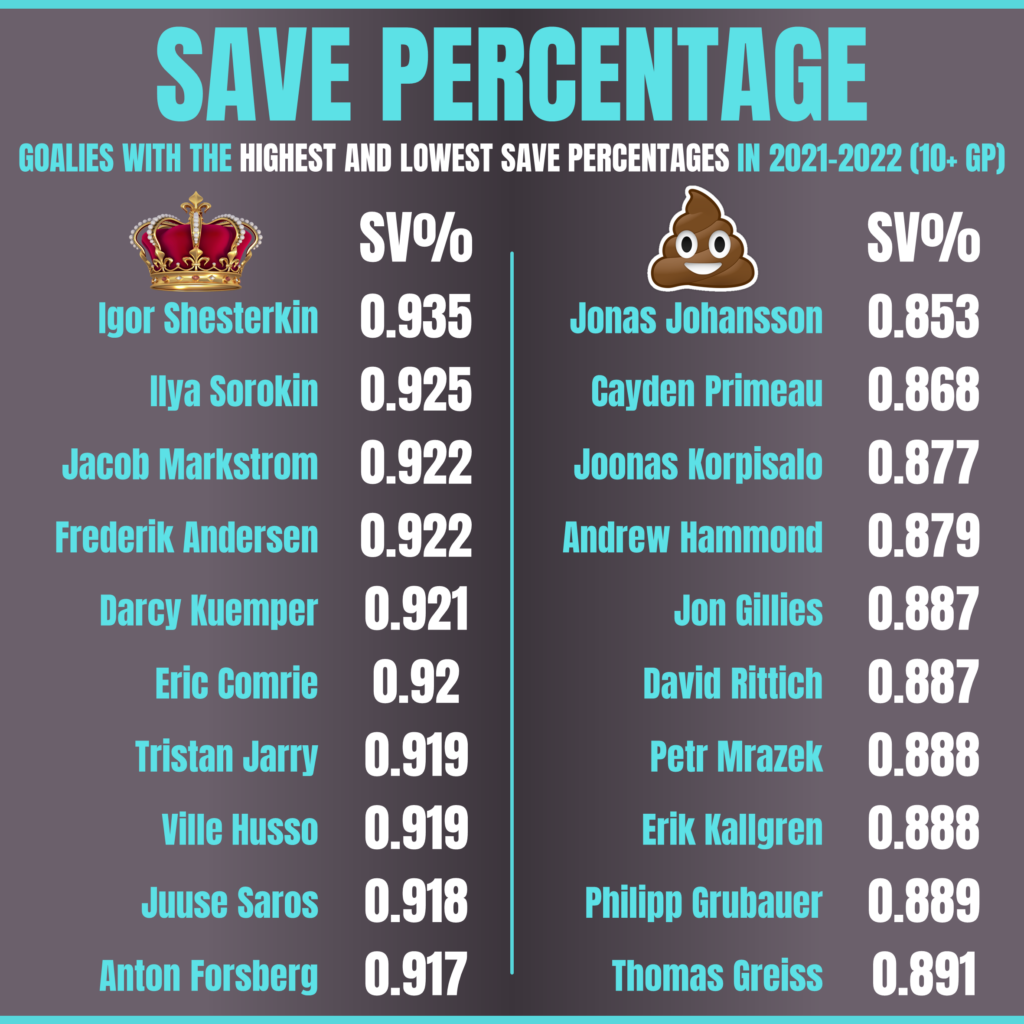
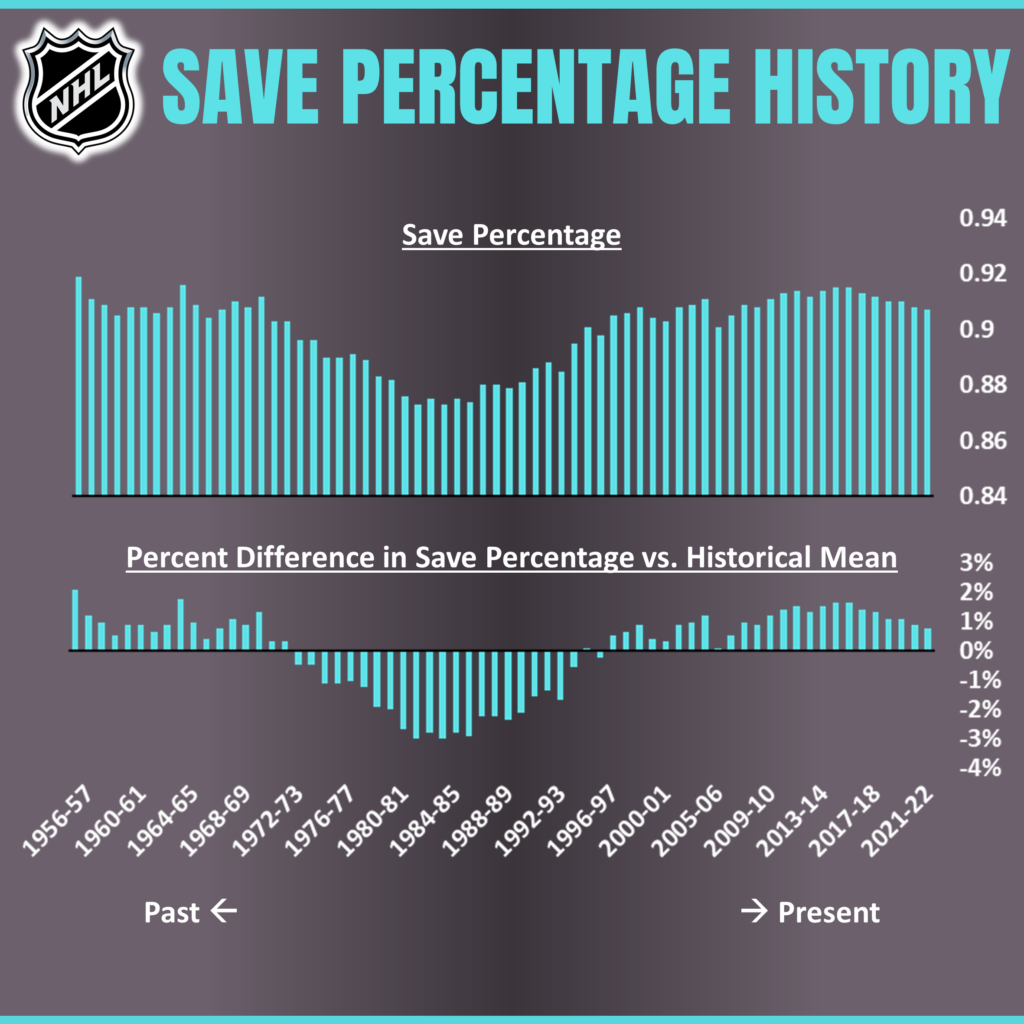
The league-average save percentage in the NHL last season (2021-2022) was .907. This number changes a bit every year, but generally stays in the .905 to .915 range (at least it has over the past 16 years). An easy (albeit oversimplified) rule of thumb: above league average = good and below league average = bad. The figure below shows the goaltenders with the highest and lowest save percentages last season (minimum 10 games played).

Goals Against Average
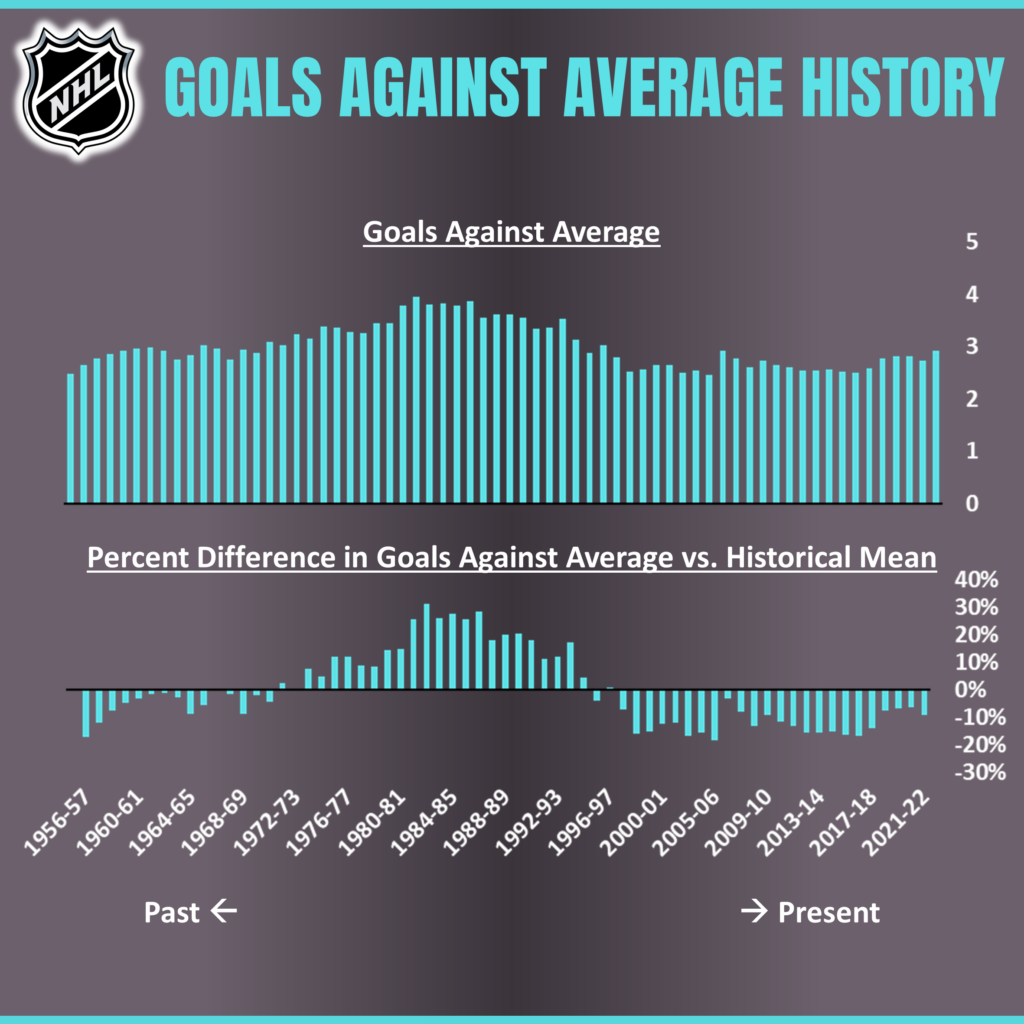
A goaltenders goals against average (GAA) is the average number of goals that they allow per 60 minutes of playing time. GAA is calculated in the same manner as “per 60” stats for players – you can find more details on that calculation HERE. GAA is generally considered a poor measure of goaltending talent when compared to save percentage as it does not take shots against into account. Nonetheless, it is the second most commonly referenced stat by NHL media members – the first being save percentage, of course.
Historically, GAA has varied more widely than save percentage. The figures below illustrate this. At it’s most extreme league average save percentage has deviated by about 3.5% from it’s historical average, whereas league average GAA has periods where it has deviated by almost 40%. This seems to imply that save percentage is a better indicator of skill, whereas GAA is heavily influenced by the era.


Shutouts
Shutouts are easy. If a goalie does not let in any goals over the course of the entire game, they are awarded a shutout. Did I really need to make a whole new section for this? Too late now, I’ve already committed to it.
I hope you enjoyed this very basic look at goalie stats! Click HERE for more Inside the Stats statistic explainers, and remember to check back soon! The data side of this great game is constantly evolving and Inside the Stats will evolve with it! Expect frequent updates to the statistic explainers as well as completely new explainers on cutting-edge stats!
Discover more from Inside The Rink
Subscribe to get the latest posts sent to your email.


Question: Last night Detroit had 40 shots on net . Of the three goals two were empty net. Yet Jake Allen is credited with 37 saves. If someone saw these stats, they would think Jake Allen allowed 3 goals. I know the two empty net goals count as shots.
Regards,
Michael Mandula.
That is very misleading based on the stats if you didn’t know about the empty-net scenario. However, looking at the GAA and Save%, you would notice the empty-net goals do not count against Allen.